Victoria Bunchek
05.26.2020
You know how valuable the information in an oil analysis report can be. But when you open it up, and a battery of numbers and convoluted terminology assaults your eyes, well, it’s hard to blame anybody for quickly setting that report aside.
Still, if you’ve supplied good reference samples and continued to collect and submit samples regularly, your oil analysis report can be a highly effective reference for extending the life of your oil and your equipment.
So, here’s an overview of what’s in a typical OA report, to make it easier for you to absorb, process and apply. (By the way, you can read more about oil analysis test methods here.)
Functional Information
Every report begins with basics including:
- Location and type of equipment
- Specified lubricant
- Service time of sampled lubricant
- Reservoir capacity
- Testing package
- Time/date of collecting the sample, receiving it and issuing the report
- Report ID, such as a SPID number (Sample Point Identifier)
This info is important not only to verify that the right tests were done on the right sample, but also to inform any recommended actions that are specific to that equipment and lubricant. For instance, a recommendation to drain, flush and replace may be fine for 2 quarts of oil, but not economical for 4,000 gallons. Filtration would then be recommended for larger systems.

Then it’s on to the meat of the report – key data about the chemical composition of your oil sample and why it matters to you …
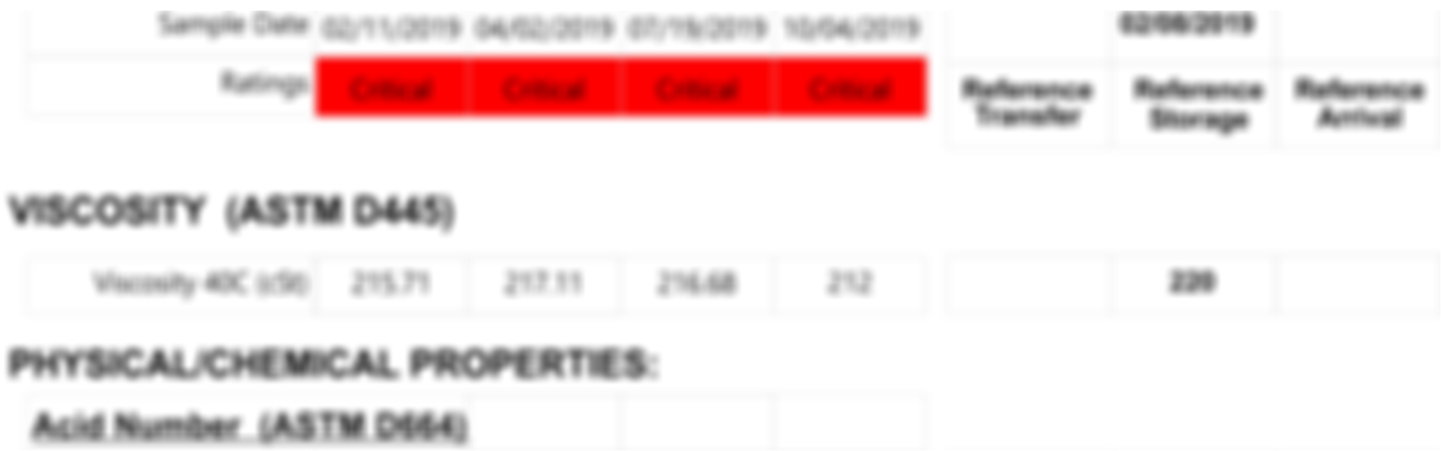
Viscosity
Viscosity can be thought of as “thickness,” or a lubricant’s ability to resist flow. The “thicker” the lubricant, the higher its viscosity and resistance to flow.
Viscosity is measured at either 40 or 100 °C (100 or 212 °F) and is reported in units of centistokes (cSt), which determines the ISO grade. For example, ISO 220 lubricant has a viscosity of 220 cSt at 40°F.
Viscosity is the most important lubricant characteristic because it determines the film that is tasked with minimizing interaction between the moving parts of your equipment. Too little separation generates wear as the components rub against one another leading to equipment failure. Too high of viscosity increases friction, and energy consumption which can also lead to burnout.
The viscosity index (VI) is a measure of how viscosity changes with temperature. Generally, as the temperature increases, viscosity decreases. Lubricants with higher VI numbers experience a smaller change in viscosity when the temperature changes. That’s what you want, since equipment temperature fluctuates on startup and cool-down. A VI over 100 is good, and anything over 150 is excellent. Generally, the viscosity index does not change for a specific lubricant unless the actual viscosity changes.
Changes in viscosity over time may indicate other problems with the oil or the equipment, and any potential concerns should be called out in the comments on your report.
Increasing viscosity may be a sign of:
- Oxidation*
- Polymerization*
- Evaporation*
- Water
- Soot*
- Cross-contamination with a higher viscosity fluid*
Decreasing viscosity may be a sign of:
- Thermal cracking*
- Shearing of additives meant to improve viscosity index*
- Cross-contamination with a lower viscosity fluid*
- Fuel
- Refrigerant
- Solvents
*Non-correctible once they have occurred
Water
The presence of abnormal levels of water decreases a lubricant’s ability to effectively lubricate the metal surfaces and causes red oxides (rust) and corrosion. Water contamination is a common cause of equipment failure.
Your report will include water concentration in parts per million (ppm), which should be well below the saturation point for your oil. If you see “KF” with your water data, that tells you that it was derived using the classic Karl Fischer (KF) titration method, which is the most precise way to determine water contamination.
FT-IR
Another method of determining water content, as well as other properties, is Fourier Transform Infrared (FT-IR) spectroscopy, a sophisticated test that uses invisible infrared rays to move the atoms in the lubricant.
This data is reported in a chart showing units of absorption per centimeter abs•cm-1 or abs/cm, where the position, height and appearance of the waves can be used to determine:
- Water content
- Oxidation properties
- Nitration properties
- Sulfation
- Soot concentration
- Glycol content
- Fuel content
Oxidation
Oxidation is a normal reaction caused by mixing oxygen, lubricant hydrocarbons and heat. Your report will show a measure of the resulting carboxylic acids, which must be monitored because they increase corrosive wear and create sludge, varnish and lacquer deposits. Nitration and sulfation reactions are more common in engine oils.
TAN (Total Acid Number)
Total acid number (TAN) refers to the amount of a basic chemical, in milligrams, needed to neutralize the acids that have built up in the lubricant. As a lubricant deteriorates, it produces more acids, which require a larger amount of basic chemical to neutralize it.
Thus, TAN will generally increase over time as the lubricant ages. Once the TAN number breaches the acceptable limits for that specific lubricant, it is considered corrosive and unstable.
The chemical reactions that can create acid in the lubricant are called oxidation and hydrolysis.
Both reactions occur more frequently at higher temperatures and result in the breakdown of the base oil and generate acid. Hydrolysis is a specific type of oxidation that is water dependent.
TBN (Total Base Number)
The chemical reactions that occur inside of crankcases produce acidic compounds that need to be neutralized so that the metal isn’t corroded. The purpose of this test is to determine how much of that acid can be neutralized by the basic substance present in the lubricant.
Equipment Conditions
You should also pay attention to certain parts of your report that shed light on potential problems inside the machine.
Wear Particle Concentration is a trending tool that determines the amount of light blocked by metals which are magnetic – generally those which are alloys of iron such as steel. Results are reported as Wear Particle Concentration (WPC) for both large (>5 microns) and small (<5 microns); but also individually as Density of Large particulate (DL) for particles greater than 5 microns, and Density of Small particulate (DS) for wear smaller than 5 microns.
Wear Particle Analysis (WPA) takes a closer look under a microscope at any wear particles of concern to help distinguish types of wear that may be occurring (bearing, gear, component misalignment), as well as the material present (low, medium, high grade steel, fibers, rust, copper, etc.).
You should see images from the slides in question, as well as explanations of potential problems and solutions.
Elemental Analysis by Inductively Coupled Plasma (ICP) super heats the elements within the lubricant which “cool off” by producing different colors of light. The colors of light are specific to each element so they can be traced back like a fingerprint to a single source. The intensity of the light can then be used to indicate how much of each element is present. While a great tool, particles larger than 8 microns cannot be detected which is where the wear particle concentration test comes in handy.
Wear Metals
Your report will have data on the presence of a range of metals that may indicate machine wear, including:
- Iron
- Tin
- Copper
- Lead
- Aluminum
- Silver
- Nickel
Other Elements
 An array of other elements may be present in your oil sample. Here are some examples, as well as possible sources.
ISO 4406 Particle Count (ISO PC)
The National Research Council of Canada did a study that looked at the failure modes of equipment across several sectors. They determined that 82% of failures were caused by particle-contaminated lubricants.
These failures were not caused by particles visible to the naked eye. Tiny particles make their way into the incredibly small machine working clearances and wreak havoc.
Your report should include counts per milliliter of lubricant for particle sizes of greater than 4, 6, 14, 21, 38, and 70 micron
Also look for an ISO particle count code of three numbers, each of which represents a range of particle count for the particle sizes 4, 6 and 14, in that order. See the chart for the range numbers.
 For example, the recommended ISO code for roller bearing lubricants is 16/14/12, meaning that 1mL of the lubricant should show 320 – 640 particles of greater than 4 microns, 80 – 160 particles of greater than 6 microns, and 20 – 40 particles of greater than 14 microns.
If that doesn’t make sense, or you have any questions about a report you receive, the experts at Trico would be happy to help you sort it out.
Additional details on reading your oil analysis report are included in this PDF.
Get Expert Help Evaluating an Oil Analysis Report
- Category:
- Oil Analysis
- Contamination